Unable to find what you're searching for?
We're here to help you find it
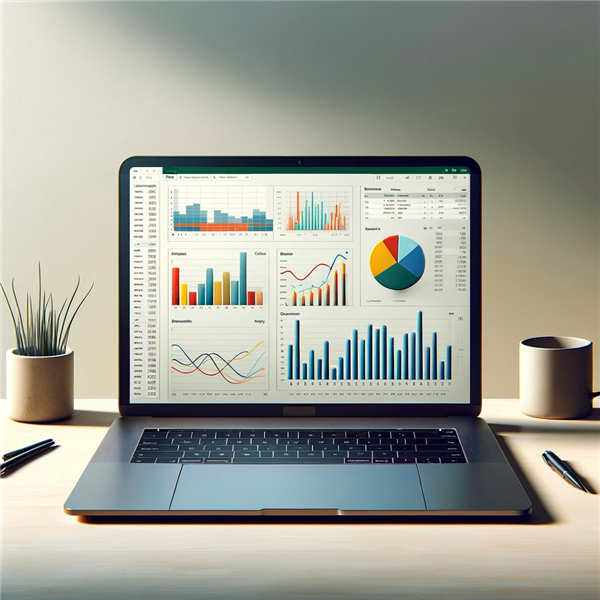
Microsoft Excel has long been the go-to tool for data analysis and reporting. In the world of business intelligence, Excel dashboards stand out for their ability to visually summarize and present complex data in an understandable and actionable format. As we look to the future, mastering Excel dashboards will become even more critical for professionals across various industries. Let's explore the evolving landscape of Excel dashboards and what it means for users and businesses alike.
The future of Excel dashboards lies in their increasing interactivity and sophistication in data visualization. Users can expect a more dynamic experience with dashboards that not only display static charts and graphs but also allow for real-time interaction with the data. This interactivity enables users to drill down into specifics, filter results, and customize views to uncover deeper insights.
As businesses become more data-driven, the demand for skilled dashboard creators is soaring. According to a report by MarketsandMarkets, the global data visualization market size is expected to grow from USD 8.85 billion in 2019 to USD 19.20 billion by 2027. This growth signifies the increasing importance of data visualization tools like Excel.
Another exciting development in the future of Excel dashboards is the integration with Artificial Intelligence (AI) and Machine Learning (ML). AI-powered analytics can provide predictive insights, forecast trends, and even suggest actions based on the data within a dashboard. Machine Learning algorithms can help identify patterns and anomalies that human analysts might miss.
These advancements not only enhance the capabilities of Excel dashboards but also streamline the workflow for those who manage them. As per a study by PwC, AI could contribute up to $15.7 trillion to the global economy by 2030, with enhanced productivity being one of the major drivers of this growth.
The customization of Excel dashboards is becoming increasingly important as users seek to tailor their reporting tools to their specific needs. Customization includes everything from the design and layout to the specific metrics and KPIs tracked. Personalization at scale means that organizations can deploy dashboards that cater to individual departmental needs while maintaining a cohesive overall strategy.
Customization not only improves the user experience but also drives better decision-making by ensuring relevant data is front and center. A survey by Forbes Insights found that 58% of executives believe that tailoring data and analytics to the needs of individual roles is important in driving operational and strategic outcomes.
The shift toward cloud computing has significantly impacted how Excel dashboards are accessed and shared. Cloud-based collaboration allows for seamless sharing and real-time updates to dashboards.

Archer Charles has top education industry knowledge with 4 years of experience. Being a passionate blogger also does blogging on the technology niche.


