

Request More Information

Email:  WhatsApp:

koenig-logo

Analyze And Visualize Data Using Microsoft 365 Copilot

03 Sep 2026   02:30 AM CST

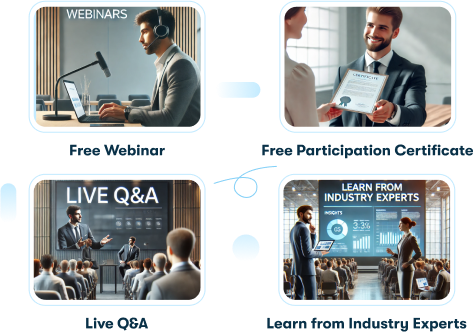
  • Free Webinar
  • Live Q&A
  • Free Participation Certificate
  • Learn from Industry Experts

Learn More About This Topic

Webinar Overview
In this course, learners discover how to apply generative AI to streamline daily tasks, enhance decision-making, and drive meaningful business outcomes. Learners will understand how to use Microsoft 365 Copilot and its functionalities to improve their productivity. The course focuses on real-world use cases—no coding required—making it ideal for those who want to confidently integrate AI into their work.
Key Points
  • This module discusses Microsoft 365 Copilot
  • It highlights how to analyze and visualize data effectively
  • Real-world use cases
Meet The Trainer
Abdelrahman Samaha Rashed

Experienced trainer with expertise in construction and telecommunications engineering, specializing in Microsoft Intune technical training. Provides customized sessions, workshops, and support, managing teams and aligning with IT goals. Past clients include Kempsey Shire Council, AT&T, and Microsoft, with recognition for outstanding customer support and network infrastructure knowledge. Proficient in guiding advisors and promoting Microsoft 365 solutions adoption.

Register for the Webinar
Registration successful!
Details have been shared over email.
Explore More Webinars
Analyze And Visualize Data Using Microsoft 365 Copilot
Show More
Webinar Summary:

In this course, learners discover how to apply generative AI to streamline daily tasks, enhance decision-making, and drive meaningful business outcomes. Learners will understand how to use Microsoft 365 Copilot and its functionalities to improve their productivity. The course focuses on real-world use cases—no coding required—making it ideal for those who want to confidently integrate AI into their work.
 

03 Sep 2026 | 02:30 AM CST   1 Hour

Raw Data To Insights Using Microsoft Power BI
Show More

Webinar Summary:

This webinar focuses on transforming raw, unstructured data into meaningful insights using Microsoft Power BI. It covers the complete data journey—from data ingestion and cleaning to modeling and visualization. Participants will learn how to connect to multiple data sources, perform data transformation using Power Query, and build interactive dashboards that drive business decisions. The session includes practical demonstrations and real-world use cases to help professionals efficiently convert raw data into actionable intelligence.


03 Sep 2026 | 04:30 AM CST   1 Hour

Introduction To Microsoft Sync Slicers, Bookmarks, Dax Calculations
Show More

Webinar Summary:

Introduction to Sync Slicers Sync Slicers in Power BI allow a single slicer selection to be applied across multiple report pages. This ensures consistent filtering and improves the user experience by eliminating the need to make the same selection repeatedly. Introduction to Bookmarks Bookmarks capture the current state of a report page, including filters, slicers, and visual visibility. They are commonly used to create navigation menus, interactive storytelling, and show/hide visual effects within reports. Introduction to DAX Calculations DAX (Data Analysis Expressions) is the formula language used in Power BI to create calculated columns, measures, and tables. It enables users to perform advanced calculations, aggregations, and business logic to derive meaningful insights from data.

03 Sep 2026 | 03:30 AM CST   1 Hour

Explore Related Courses

AB-730T00: Transform business workflows with generative AI