Unable to find what you're searching for?
We're here to help you find itIn today's data-driven landscape, the ability to interpret complex datasets and present them as clear, actionable insights is a critical business advantage. This is where Microsoft Power BI, a powerful business intelligence tool from the Microsoft corporation, excels. It enables users to connect to various data sources, create interactive visualizations, and share insights across their organization. The importance of making informed, data-backed decisions cannot be overstated, and Power BI is a cornerstone of this modern approach.
This guide is designed for a wide range of professionals, including Data Analysts, Business Intelligence Professionals, IT Professionals, Project Managers, and Business Executives. It will walk you through the core concepts you need to master, mirroring the structured approach you'll find in comprehensive training programs, like the Introduction to Power BI course offered by Koenig Solutions. We will cover everything from the Power BI basics for beginners to the steps needed to create analytics dashboards in Power BI.
Purchase This Course
USD
View Fees Breakdown
| Course Fee | 650 |
|
Total Fees (without exam) |
650 (USD) |
♱ Excluding VAT/GST
You can request classroom training in any city on any date by Requesting More Information
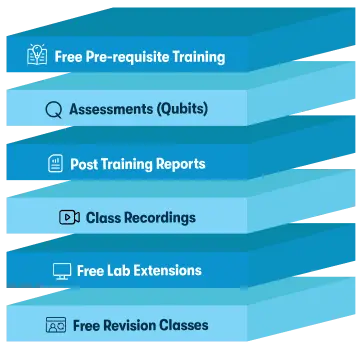
Inclusions in Koenig's Learning Stack may vary as per policies of OEMs
Scroll to view more course dates
You can request classroom training in any city on any date by Requesting More Information
♱ Excluding VAT/GST
*Inclusions in Koenig's Learning Stack may vary as per policies of OEMs